

Every ton satisfies a regulation. Every dataset tells the truth.
Measure
Every
Molecule.
Sensor networks bolted to smokestacks, embedded in soil, and mounted on rooftops — delivering parts-per-billion accuracy for EPA filings, Scope 1 inventories, and methane plume mapping.
Stack ID
CEMS-07 · Facility #NJ-3841
Updated 14s ago · EPA Method 21 compliant
A singlemoleculeof methaneexitsa landfill ventat3:47 AM.By dawn,it has joined847 billion others.By quarter-end,your facilityowes the EPAan accounting.Fluxmeasuresthe first molecule.So you ownthe last report.
2,400+
Active sensor nodes
847B
Readings per quarter
99.97%
EPA filing accuracy
< 8ms
Transmission latency
Smokestacks don't lie. Neither does your EPA report.
Cement kilns, steel furnaces, chemical reactors — every combustion event emits a measurable signature. Flux CEMS units bolt directly to stack flanges, survive 1,400°F flue gas, and stream CO₂, SO₂, NOₓ, and particulate data to your compliance dashboard in under 8 milliseconds. No interpolation. No estimation. The number the inspector sees is the number the sensor measured.
- IP67-rated enclosures rated for −40°C to +85°C
- NDIR + electrochemical dual-sensor redundancy
- Automatic QA/QC flags per 40 CFR Part 75

Real methane readings. No smoothing. No delays.
Aging landfill infrastructure leaks methane at rates that compound quarterly. Our soil-embedded sensor grids triangulate plume origin within 3 meters, quantify flux rates in g/m²/day, and generate the geospatial boundary maps that LMOP compliance requires. The data below is live from a 47-acre municipal landfill in Alameda County, California — published unedited.
- Plume origin triangulation to ±3 meter accuracy
- LMOP and EPA Method 25C compatible output
- Automatic OGI-equivalent leak detection alerts
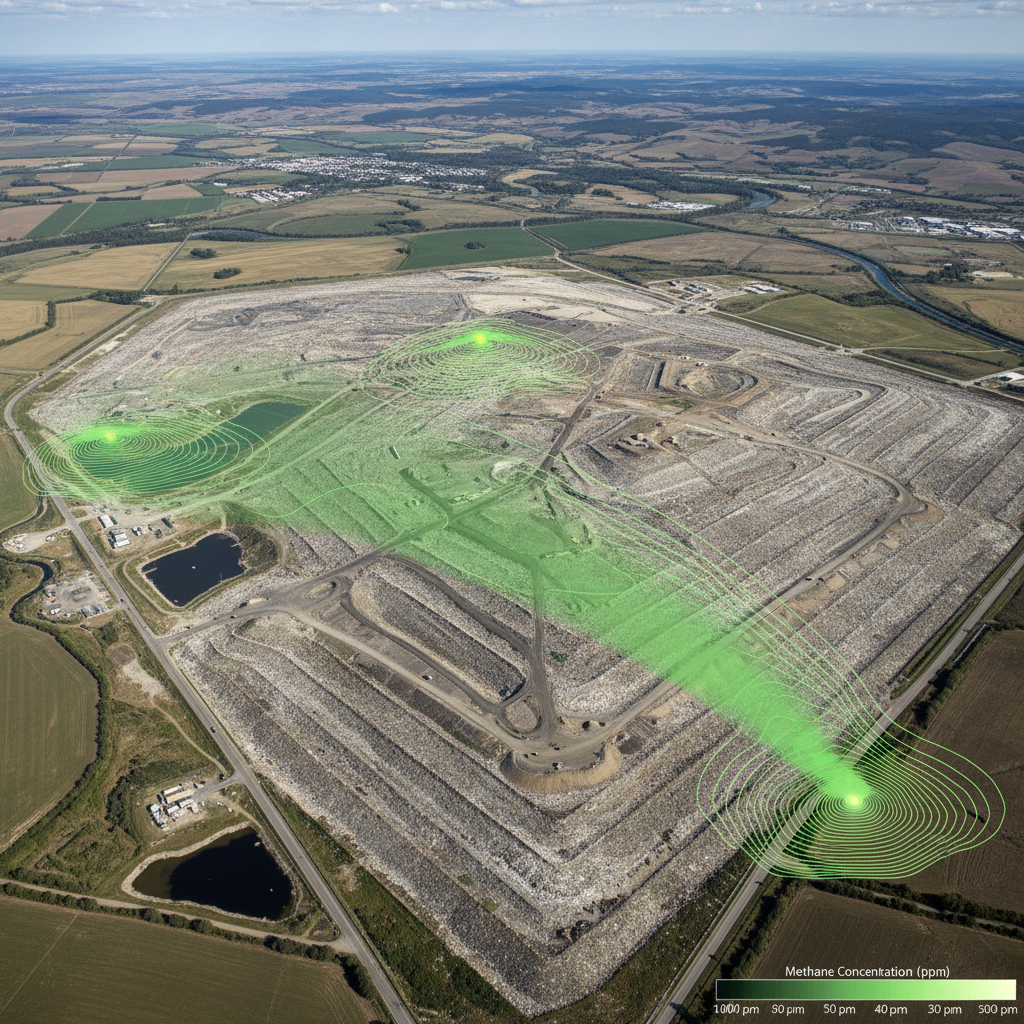
Soil breathes. Flux listens at 900 MHz.
Enteric fermentation, manure management, and nitrogen cycle emissions account for 11% of US greenhouse gas output — yet most agricultural facilities still rely on IPCC Tier 1 emission factors calculated from herd counts and feed logs. Flux replaces estimation with measurement: solar-powered sensor stakes every 200 meters, continuous N₂O and CH₄ readings, and automatic Scope 1 inventory updates that sync to your CDP disclosure platform before each reporting window.
- Solar-powered, 18-month autonomous operation
- LoRaWAN mesh network, no cellular dependency
- Direct CDP and GHG Protocol inventory integration

The cost of a missed reading: $70,117 per day.
EPA's Clean Air Act Section 114 penalties for CEMS data gaps start at $25,000 per day per violation. Add Title V permit deviation fees, state enforcement multipliers, and the cost of a third-party audit triggered by a data gap, and a single missed quarterly filing can exceed $280,000 before legal fees. Flux's redundant sensor architecture and automated substitute data procedures eliminate data gaps before they become violations.
- Automated substitute data under 40 CFR 75.33
- Real-time compliance status dashboard per stack
- Regulatory counsel review queue built into workflow

Three visualizations.
Judge the data before the download.
Real readings from active Flux deployments. Published without smoothing, interpolation, or editorial selection.
Viz 01 — Real Methane Readings
Alameda County Landfill · CH₄ Concentration · 24h
Current
1,893 ppb
24h peak
1,935 ppb
24h Δ
+11 ppb
Global avg
1,923 ppb
Viz 02 — Regulatory Timeline
US Federal GHG Enforcement Escalation · 2016–2028
EPA Subpart OOO methane rule finalized
mediumRollback of Subpart OOO rescinded by courts
lowIRA Section 136 methane fee enacted: $900/ton
highEPA tightens NSPS OOOOb — quarterly monitoring required
highSEC climate disclosure rule Phase 1 effective date
mediumIRA methane fee escalates to $1,500/ton
criticalProjected federal GHG inventory mandate for facilities >25k MTCO₂e
criticalViz 03 — Cost-of-Noncompliance Calculator
What does a data gap actually cost?
Base Penalty
$25,000
Daily Fine
$70,117/day
+ Audit Costs
$92,847.42
+ Legal Fees
$61,898.28
Total Exposure (7-day gap, 1 stack)
$670,564.7
Flux annual cost
$48,000
You keep $622,564.7
The Continuous
Emissions Monitoring
Playbook.
84 pages. Written by former EPA enforcement attorneys and field instrumentation engineers. Covers CEMS selection criteria, QA/QC protocols, substitute data procedures, and a facility-by-facility compliance calendar through 2028.
- EPA Method 21 compliance checklist (47 line items)
- Scope 1 calculation template (GHG Protocol aligned)
- Continuous vs. periodic monitoring decision matrix
- Penalty exposure calculator by facility class
- Vendor evaluation rubric for CEMS procurement
No spam. Unsubscribe anytime. Used by 1,200+ compliance professionals.
Get instant access
Two fields. No phone number. No demo request.
Three resources.
Available now, no form.
If the Playbook earns trust through data, these resources earn it through utility. Take them.
EPA Method 21 Compliance Checklist
47 line-item checklist covering instrument calibration, QA/QC frequency, data completeness thresholds, and deviation reporting timelines. Used by compliance teams at 14 cement facilities currently under Title V permits.
Download ChecklistScope 1 GHG Inventory Calculation Template
Excel and CSV-compatible template aligned to GHG Protocol Corporate Standard. Covers stationary combustion, process emissions, and fugitive sources. Pre-formatted for CDP, TCFD, and SEC climate disclosure export.
Download TemplateContinuous vs. Periodic Monitoring: What the EPA Actually Requires
March 12, 2026 · 2:00 PM ET. Former EPA Region 2 enforcement counsel and two CEMS field engineers walk through the decision criteria, cost tradeoffs, and compliance risk profiles for both approaches. 90 minutes with live Q&A.
Reserve Your SeatAll resources are written by Flux instrumentation engineers and reviewed by EPA enforcement counsel.